Disclaimer: I was laid off from my role at Blueboard 2 days prior to the release of this product. While I don’t have metrics, I’ll share about expected outcomes.
Problem: When users were viewing the experience catalog, or “Menu” as well called it, we found there was about a 70% bounce rate after about 4-5 minutes in a session. Keep in mind, we were hovering in the mid 50% redemption rate, meaning a little over half of the rewards being sent out were actually being redeemed. While there are various reasons for the redemption rate to be hovering under our expected 60-65% target (such as users holding onto rewards for special occasions or just not having time), we zoned in a specific gap in our product – the lack of personalization or recommendation features.
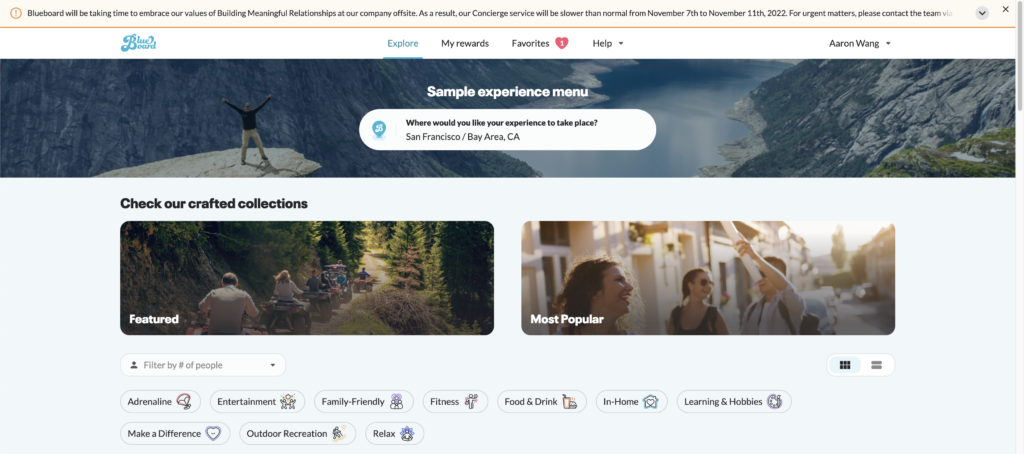
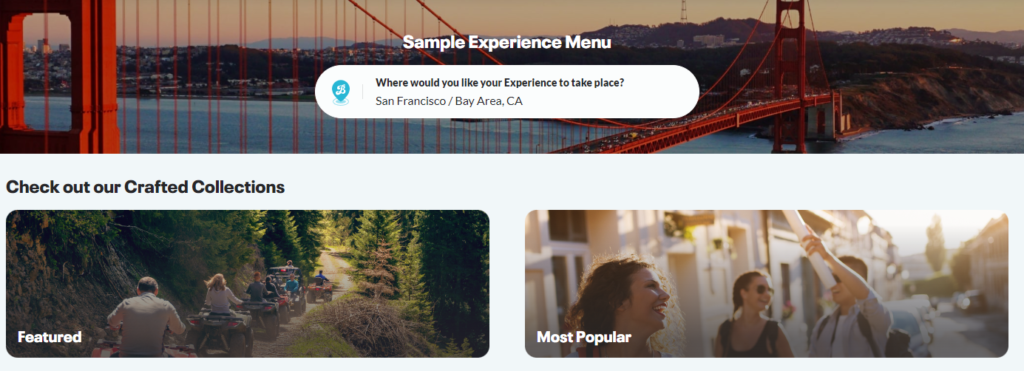
The menu itself is a grid view that scrolls until the end. There are filters based on experience categories, but other than that, users have to scroll through the menu to find what they’re looking for. The Blueboard menu was difficult to parse through and the platform lacked any sort of recommendations or “inspo” to help people find experiences that were relevant to them.
Research: Aside from the aforementioned bounce rate data, we really did not have much else to go off of. Instead, we conducted a Google Optimize A/B test and found that when we had an icon that showed top-rated experiences, we found a small uptick in incremental redemptions in those listed experiences. We decided to take this hypothesis and commit to code via an MVP.
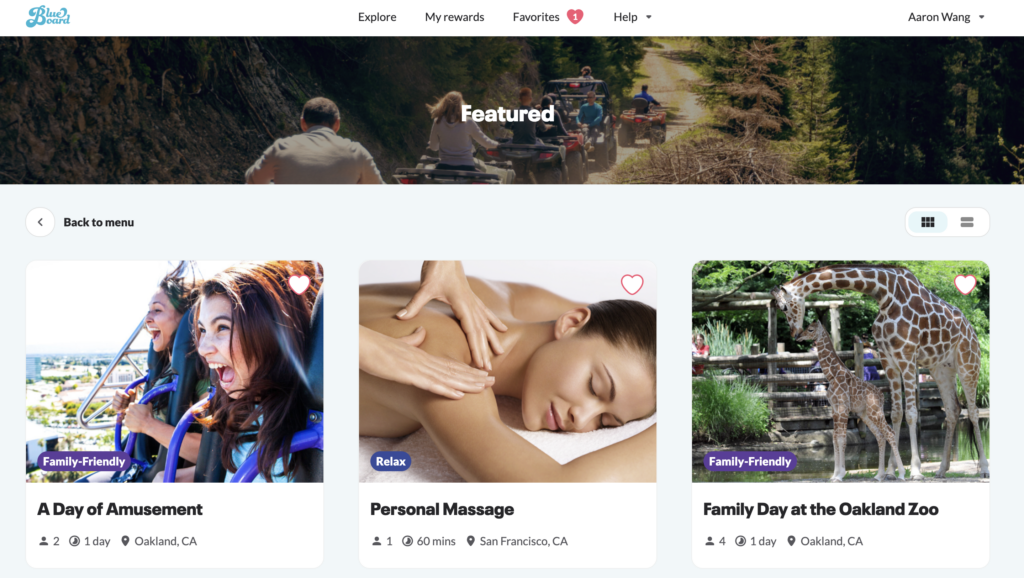
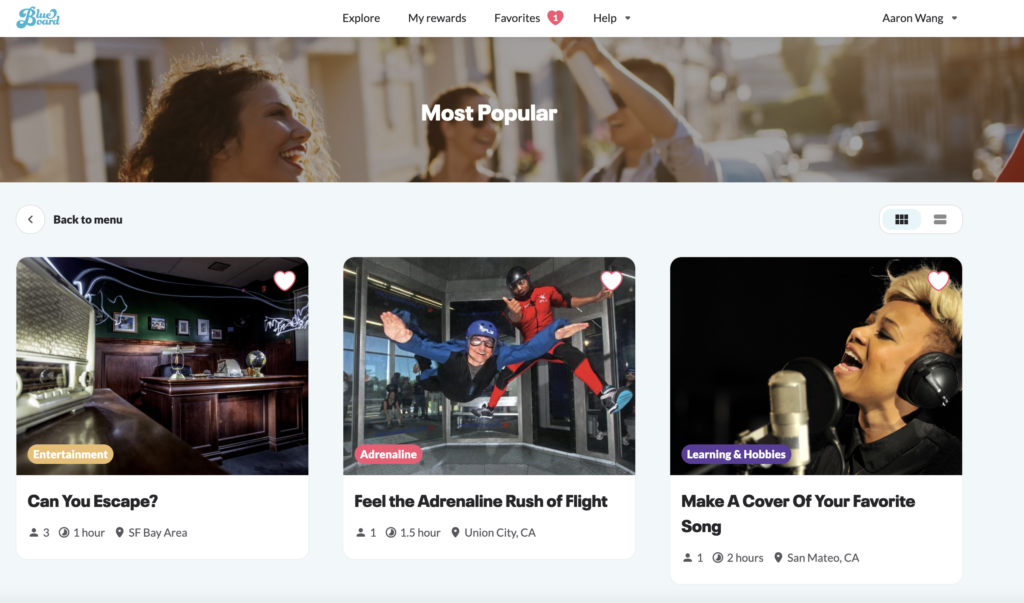
Solution: “Collections” was born. We targeted our top 15 cities and selected 10-15 rewards per reward tier to display in a “Featured” collection of experiences. The idea was to create a mix, similar to eCommerce practices, where we curate select experiences with a mix of high-margin items, new items, and popular items together to generate demand. We included a second collection that queried our top-rated experiences depending on the user’s location and reward tier (with a minimum of 10 ratings) and called that our “Most Popular” Collection.
Outcomes: From a metrics point of view, we would have known our hypothesis to be true when we saw incremental increases in the redemption of selected experiences in our Collections. In addition, we may have seen an uptick in overall reward redemption but we definitely would have seen improvements in the time to redeem (the time between a reward being activated and redeemed).
Ultimately, the Collections roadmap was meant to become the first stage in a recommendations framework. The idea was to first identify if users could be motivated by external factors such as popularity or specially curated lists (sort of like the “Chef’s Specials” in a restaurant). The next stage would to be roll out Collections to a larger scale of cities, preferably cities with fully curated experience menus. The ultimate goal was to reach a place where we could build profiles on our userbase to track similarities or trends in how they browsed the menu. We wanted to be able to create a relevant framework that would track tags/categories across the various experiences a user views and based on occurrence, create a weight-based relevance experience to help inform us on what users personally liked or weren’t interested in.